
Introduction
Most maintenance teams have replaced the same component on the same machine two or three times — and called it fixed each time. Then it fails again. The problem isn't the part. It's that no one looked past the symptom to find what actually caused it.
That cycle is expensive. According to Siemens' True Cost of Downtime 2024 report, unplanned downtime costs the world's 500 largest manufacturers $1.4 trillion annually — roughly 11% of revenues. Large plants average $253 million in annual losses, with facilities experiencing around 25 downtime incidents per month.
Root Cause Analysis (RCA) is the structured discipline that breaks that cycle — it finds why something broke, not just what broke, so the fix actually holds.
This guide walks through the core RCA methods, the tools maintenance teams use in practice, and a step-by-step process for running an investigation that produces a permanent fix — not another temporary patch.
Key Takeaways
- RCA finds the underlying cause of downtime, not just the broken part — so the failure doesn't repeat.
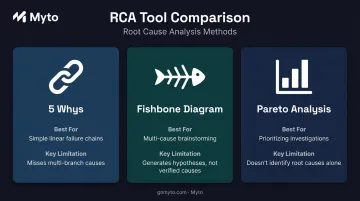
- The three core RCA tools — 5 Whys, Fishbone Diagrams, and Pareto Analysis — each fit different problem types.
- Effective RCA follows six steps — from defining the problem and collecting data through implementing corrective actions and monitoring results.
- The most common RCA failure point is incomplete data — especially missing frontline operator knowledge.
- Every completed RCA builds a pattern library that makes future investigations faster and more accurate.
What Is Root Cause Analysis for Downtime?
RCA is a structured problem-solving method that identifies the fundamental cause of an unplanned downtime event — not just the component that failed. The goal is permanent elimination of the failure mode, not a temporary patch that holds until the next occurrence.
Where RCA Applies in Manufacturing
RCA isn't limited to dramatic equipment failures. It applies across:
- Mechanical breakdowns: motor faults, bearing failures, unexpected equipment stops
- Process stoppages triggered by parameter drift, tooling wear, or material inconsistencies
- Quality-related line stops due to defects or out-of-spec output
- Safety incidents and near-misses where equipment condition played a role
- Chronic low-OEE situations where no single dramatic failure explains persistent underperformance
Reactive vs. Proactive RCA
Most teams start with reactive RCA — investigating after a failure has already occurred. Mature operations layer in proactive RCA as well: reviewing equipment condition, near-miss data, and historical failure patterns to catch problems before they reach the floor. The more consistently both approaches are applied, the fewer repeat failures appear on the maintenance log.
Why RCA Is Critical for Manufacturing Operations
Every unplanned stoppage carries costs beyond the hours of lost output. Siemens identifies cost drivers that include idle staff wages, emergency replacement parts, and contractual compensation penalties — none of which disappear by replacing the failed component. They just reset the clock for the next occurrence.
The Compounding Cost of Fixing Symptoms
When a team applies a quick fix without identifying the root cause, the failure recurs. Each recurrence brings the same full cost stack:
- Lost production time
- Emergency labor costs
- Expedited parts and shipping
- Schedule disruption downstream
- Potential customer penalties
Multiply that across a year of recurring failures and the number compounds fast.
RCA breaks this pattern. Once the underlying cause is understood and corrected, that cost stack is eliminated, not just deferred to the next occurrence.
The Shift from Reactive to Preventive
When root causes are systematically addressed, maintenance teams stop operating in permanent firefighting mode. They begin building reliable, predictable production environments where failure modes are known quantities, not surprises.
That predictability shows up in OEE Availability — calculated as Run Time divided by Planned Production Time. Of the three OEE components, Availability is the one most directly dragged down by recurring failures.
Permanently eliminating a failure mode raises Availability in a way that repeated patching never can. Each closed RCA is a permanent subtraction from your downtime total.
The Knowledge Base Effect
RCA findings create something valuable beyond the immediate fix: a shared organizational record of how and why failures occur. Over time, this reduces dependence on individual experts, accelerates onboarding for new technicians, and provides the pattern data that makes future investigations faster. That organizational benefit compounds with every completed investigation.
RCA Tools and Methods: Choosing the Right Approach
No single tool fits every downtime scenario. The right choice depends on failure complexity, available data, and how many contributing factors are likely involved.
The 5 Whys
Ask "Why?" repeatedly — typically five times — until you reach an underlying cause rather than a symptom.
Best used for: Straightforward, single-thread failure chains where speed matters and data is limited.
Manufacturing example: A spindle motor fails → Why? Overheating → Why? Restricted airflow → Why? Clogged intake filter → Why? No scheduled filter inspection on the PM checklist. Five questions, one actionable corrective action.
The 5 Whys works well when the failure chain is linear. Once multiple contributing factors appear, it tends to follow one branch and miss the others — that's when a Fishbone diagram earns its place.
Fishbone (Ishikawa) Diagram
A visual tool that maps potential causes across structured categories — typically Equipment, People, Processes, Materials, and Environment — before narrowing to the most likely contributors.
Best used for: Complex downtime events with multiple possible causes, where cross-functional brainstorming is needed to avoid missing contributing factors.
The Fishbone surfaces possible causes, not verified ones. It's a hypothesis-generation tool, not a verification method — the causes it produces still need to be confirmed against real data before driving corrective action.
Pareto Analysis
Applies the 80/20 principle to rank downtime causes by frequency or total impact, identifying which failure modes account for the largest share of lost production time.
Best used for: Prioritization — deciding which failure modes deserve the most urgent RCA attention first, not for identifying root causes directly.
A common trigger: if three or fewer failure modes account for more than 60% of your downtime hours, start your RCA investigations there before touching anything else.
Quick Reference: Which Tool to Use
| Tool | Best For | Key Limitation |
|---|---|---|
| 5 Whys | Simple, linear failure chains | Misses multi-branch causes |
| Fishbone Diagram | Multi-cause brainstorming | Generates hypotheses, not verified causes |
| Pareto Analysis | Prioritizing where to investigate first | Doesn't identify root causes on its own |
How RCA for Downtime Works: Step by Step
The six steps below reflect how RCA is run in real manufacturing environments. Skipping or rushing any step (especially data collection) is the most common reason investigations produce incomplete conclusions.
Step 1 – Define the Problem
Write a specific problem statement that captures:
- Which equipment failed
- What was observed (symptoms, error codes, outputs)
- When it occurred and how frequently
- How much downtime resulted each time
Vague problem definitions produce vague root causes. The goal at this stage is to describe what happened, not why — premature theories bias the investigation before the data is reviewed.
Step 2 – Collect Data and Evidence
Gather all available evidence:
- Downtime logs and maintenance records
- Machine sensor data and alarm histories
- MTBF and MTTR history for the affected equipment
- Production schedules and shift reports
- Previous work orders and corrective actions for similar failures
One frequently missed source: frontline operator knowledge. As ASQ Quality Progress notes, "without effective data gathering, causal factors and root causes cannot be identified." Experienced technicians carry diagnostic observations (sounds, patterns, timing) that rarely make it into formal logs. Capturing this input is often the difference between a surface fix and a real one.
Step 3 – Identify Possible Causes
Apply the appropriate RCA tool based on the problem's complexity. Cast wide before narrowing: list all plausible causes before eliminating any.
Cross-functional involvement is essential here. Maintenance, operations, engineering, and floor supervisors each see different aspects of the same failure. Siloed analysis produces biased conclusions: problems get attributed to whoever wasn't in the room.
Common RCA tools at this stage include:
- 5 Whys for straightforward, single-cause failures
- Fishbone (Ishikawa) diagrams for multi-factor problems across people, process, and equipment
- Fault tree analysis for complex failures with branching failure paths
Step 4 – Verify the Root Cause
Test the hypothesis. Confirm that removing the suspected root cause would actually prevent recurrence through historical data, controlled testing, or expert review.
The most common error at this step: stopping at "operator error" or "part failure" without asking what process gap, training deficit, or system condition allowed that error or failure to occur. "Operator error" is rarely a root cause. It's almost always a symptom of something upstream.
Step 5 – Implement Corrective Actions
Develop specific, time-bound corrective actions with named owners. Vague directives like "improve maintenance" don't stick. A real corrective action looks like: "Add filter inspection to PM-047 checklist, assigned to maintenance supervisor, completed by [date]."
Typical corrective action categories:
- Adjusting PM schedules or inspection intervals
- Retraining operators on specific procedures
- Replacing or upgrading components prone to premature failure
- Updating SOPs to document previously informal steps
- Adding monitoring or alerts for early warning indicators
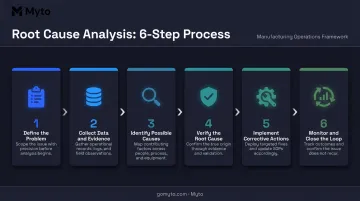
Step 6 – Monitor and Close the Loop
Track downtime data after implementation to confirm the failure mode has been eliminated. Set a defined window (90 days without recurrence is a reasonable threshold for most failure modes) before formally closing the investigation.
Feed findings back into the operation's knowledge base. The value of an RCA investigation isn't just the fix. It's the documented insight that stays accessible to the whole team, not only the people who ran it.
RCA for Downtime: Example Case Walkthrough
A manufacturing facility experiences repeated unplanned stoppages on a critical production line. The maintenance team has replaced the same spindle motor three times in six weeks. Each replacement restores production for a week or two, then the failure recurs.
Step 1 – Define the problem: Repeated spindle motor failures on Line 3, approximately 4 hours of downtime per event, three occurrences in six weeks.
Step 2 – Collect data: Maintenance logs show an overheating pattern before each failure. One operator's informal notes mention unusual noise preceding the last two events. Sensor data confirms temperature spikes in the 40 minutes before each shutdown.
Step 3 – Identify possible causes: Applying 5 Whys: motor failure → overheating → restricted airflow → clogged intake filter → no scheduled filter inspection in the PM program.
Step 4 – Verify: Historical data confirms the filter was never on the PM checklist. Cross-referencing with the three failure dates shows each occurred 6–8 weeks after the previous inspection — consistent with a clogging timeline.
What the data alone couldn't show was an experienced operator who had been manually checking and clearing the filter every few weeks. This was never documented. When that operator was absent or on a different shift, no one else knew the check existed.
The undocumented workaround masked the real problem from formal records entirely. It held the line together informally — until it didn't.
Corrective actions implemented:
- Filter inspection added to the formal PM checklist with a defined interval
- Temperature threshold alert configured to flag early-stage overheating
- Operator procedure documented and shared across all shifts
An academic case study on an automobile engine production line found that RCA-driven PM improvements increased operational availability from 82.25% to 85.09% and increased MTBF from 73.6 to 114.2 minutes. The gains held because the fix was documented and distributed — not dependent on one person's memory or presence on shift.

How Myto Can Help
The case walkthrough above illustrates a problem that RCA methodology alone can't fully solve: the knowledge that matters most often lives only in someone's head.
Myto is built specifically to close that gap. Using wearable AI glasses, the platform captures operator expertise hands-free, in the natural flow of work — with no paperwork and no extra steps required from the operator. When a senior technician performs an informal filter check, runs a diagnostic sequence, or compensates for a known equipment quirk, Myto records it.
That captured knowledge is then automatically structured into SOPs, troubleshooting flows, and shift documentation.
For RCA investigations, this changes Step 2 fundamentally. Instead of relying on what made it into formal logs, investigation teams can access real operator workflows, prior troubleshooting sequences, and machine-specific context that would otherwise be invisible. Myto's Operational Data Integration layer stitches that captured knowledge together with existing data from CMMS, MES, SCADA, ERP, and maintenance ticketing systems — creating a single structured knowledge base rather than disconnected silos.
The value compounds over time. Each investigation adds to a growing intelligence layer that Myto's AI agents can query to assist with future troubleshooting, surface likely root causes based on prior failure patterns, and generate documentation. This shifts teams from reactive RCA — investigating after failures — toward proactive prevention, where conditions that match known failure signatures get flagged before the line goes down.

The difference from traditional CMMS is concrete:
- CMMS records: a bearing was replaced on a given date
- Myto captures: how the technician diagnosed the problem, what they checked first, and what they noticed before the failure occurred
That diagnostic context is exactly what RCA investigations need — and what most systems never collect.
Conclusion
Effective RCA for downtime is a systematic discipline. Practiced consistently, it eliminates recurring failures and builds a more predictable production environment — not just a paper trail after something goes wrong.
The process improves with every investigation. Each completed RCA adds to the organization's collective understanding of how its equipment fails and why. The teams that benefit most are the ones that retain the knowledge their investigations produce. Good methodology only compounds when the findings survive shift changes and retirements.
Myto ensures those insights don't walk out the door. Investigation findings get captured and structured automatically, then made available to every technician on every shift — not just the ones who were present when the problem was solved.
Frequently Asked Questions
What is root cause analysis of downtime?
RCA for downtime is a structured method to identify the underlying cause of an equipment or process failure — not just repair what broke — so the same stoppage doesn't repeat. It's used across manufacturing for both isolated events and chronic failure patterns where the same issue keeps recurring.
What are the 5 P's of root cause analysis?
The 5 P's — People, Process, Parts/Equipment, Place/Environment, and Procedures — are a cause-categorization framework used to ensure all contributing factors are considered during an investigation. They serve a similar function to the categories in a Fishbone Diagram, preventing teams from focusing too narrowly on one dimension of a failure.
What are the 3 R's of RCA?
The 3 R's stand for Recognize (identify and clearly define the problem), Resolve (find and verify the root cause), and Review (implement corrective actions and monitor their effectiveness). Together they represent the core cycle of any structured RCA process.
What are the most common tools used in root cause analysis for manufacturing downtime?
The three most widely used tools are 5 Whys (best for simple, linear failure chains), Fishbone/Ishikawa Diagrams (best for complex, multi-factor problems), and Pareto Analysis (best for prioritizing which failure modes to investigate first). Combining them — such as using Pareto to prioritize, then 5 Whys to dig in — often produces the clearest picture.
How is RCA different from regular troubleshooting?
Troubleshooting focuses on restoring equipment to working condition as quickly as possible. RCA goes further to understand why the failure occurred so it can be permanently prevented. Troubleshooting fixes the current event; RCA prevents the next one.
How long does a root cause analysis take in manufacturing?
Duration scales with complexity. A straightforward 5 Whys investigation can wrap up in under an hour. A major recurring failure involving multiple contributing factors may require days of data collection and cross-functional review.