That's not random degradation. It's a system problem.
Understanding where downtime actually originates — not just which machine stopped, but why — is what separates facilities that continuously improve from those that manage the same failures month after month. This guide covers the primary causes of heavy manufacturing downtime, what it costs when those causes go unaddressed, and the prevention strategies that make production more reliable over time.
Key Takeaways
- Unplanned downtime is the primary cost target — planned stops can be prepared for, unplanned ones cannot
- Equipment failure, operator knowledge gaps, process inefficiency, and supply chain gaps drive the majority of incidents
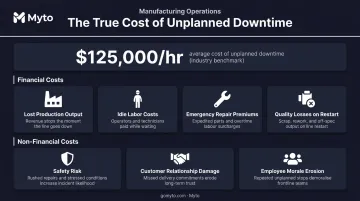
- ABB's 2023 industrial survey puts the average cost of unplanned downtime at $125,000 per hour across industrial operations
- Prevention requires maintenance, knowledge standardization, supply chain management, and operational visibility acting in concert
- Most downtime events signal risk before they happen through micro-stops, aging equipment, and over-reliance on a few veteran operators
Common Causes of Heavy Manufacturing Downtime
Downtime is any period when a production line, machine, or or asset is not producing during scheduled run time. That definition covers two distinct categories:
- Planned downtime — changeovers, scheduled maintenance windows, shift transitions. These can be prepared for, compressed, and controlled.
- Unplanned downtime — equipment failures, operator errors, missing materials, and process breakdowns. These arrive without warning and carry no buffer.
Unplanned downtime is the primary target for reduction. Planned stops are a cost of doing business; unplanned stops are a cost of a system that hasn't caught up to its own failure modes.
In heavy manufacturing, unplanned events typically trace back to one or more of four root causes. Many facilities focus almost entirely on equipment — which matters — but human and process factors are responsible for more events than most production teams track.
Equipment Failure and Deferred Maintenance
Equipment failure is the single largest driver of unplanned downtime in heavy manufacturing. Plant Engineering's maintenance research found that 44% of respondents cited aging equipment as the leading cause of unscheduled downtime — a finding that held in their 2021 follow-up, where aging equipment remained the top cause ahead of mechanical failure and operator error.
Most failures don't arrive as sudden catastrophes. Early warning signals — unusual vibration, elevated temperature, minor lubrication gaps — go unaddressed in reactive maintenance cultures until they become line-stopping events.
At that point, the cost structure changes. Expedited part orders, overtime labor, and emergency contractor rates all compound the direct production loss.
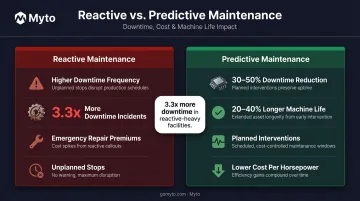
NIST quantified the scale of this gap. Facilities in the top 25% for reactive maintenance reliance experienced 3.3 times more downtime than facilities in the bottom 25% — a difference that translates directly to availability and margin.
Operator Knowledge Gaps and Tribal Knowledge Loss
In heavy manufacturing, a significant share of operational expertise exists only in the heads of experienced workers. Troubleshooting sequences, machine quirks, setup procedures, fault patterns — these rarely make it into formal documentation. When experienced operators retire, change shifts, or leave, that knowledge goes with them.
The Manufacturing Institute and Deloitte project that U.S. manufacturers may need 3.8 million additional workers between 2024 and 2033, with up to 1.9 million positions potentially unfilled. The median age in manufacturing is 43.9 years — knowledge transfer isn't a future problem. It's a present one.
When a newer operator encounters an unfamiliar fault condition, the knowledge gap becomes a downtime event. Common patterns include:
- Can't locate a current procedure for the fault condition
- Spends far longer resolving the issue than a veteran would
- Escalates unnecessarily, pulling a senior technician off other work
- Applies the wrong fix, extending or repeating the event
Process Inefficiency and Scheduling Failures
Not every downtime event starts with a machine. Many originate in the production system itself:
- Changeovers that haven't been optimized in years, consuming hours of availability per week
- Jobs scheduled without accounting for realistic setup time
- Bottleneck stations loaded beyond their practical capacity
- High-mix lines where product family transitions trigger cascading delays
These losses show up in OEE as availability losses (setup and adjustment time) and performance losses (idling and minor stops), but they're often attributed to equipment rather than process design. The result is recurring losses with no corrective owner.
Material Shortages and Supply Chain Disruptions
Lean inventory models create vulnerability when a single missing component can halt an entire production line. Poor demand forecasting, long supplier lead times, and inadequate critical spare parts inventory all contribute to a specific failure pattern: a line that stops not because anything broke, but because the right part or material isn't on site.
The Siemens/Senseye 2024 report names supply chain delays in sourcing emergency replacement parts as one reason downtime recovery times have grown — a dynamic that compounds the original incident into an extended, uncontrolled stop.
What Happens If Downtime Is Left Unaddressed
The Financial Cost
The hourly cost of downtime in heavy manufacturing is not uniform, but the floor is high. According to ABB's 2023 Value of Reliability survey, unplanned downtime costs industrial operations $125,000 per hour on average. For large automotive plants, Siemens/Senseye puts that figure at $2.3 million per unproductive hour — more than $600 per second.
These numbers reflect more than lost output. The full cost structure includes:
- Lost production output — units not produced × margin per unit
- Idle labor costs — operators and technicians on the clock during the stop
- Emergency repair premiums — reactive repairs at 2-3x the cost of planned work
- Quality losses on restart — first-run defects and scrap as lines come back online
NIST estimates that preventable maintenance issues across U.S. manufacturing generated $100.2 billion in lost sales from delays and defects in a single measurement year — compared to $18.1 billion in direct downtime costs.
The Non-Financial Cost
Financial losses show up immediately in production reports. The non-financial costs take longer to surface — and by the time they do, some are already difficult to reverse:
- Safety risk spikes during unplanned startups and shutdowns. The U.S. Chemical Safety Board reports that 50% of process safety incidents occur during startups, shutdowns, and other infrequent operational events — precisely the conditions that unplanned downtime creates.
- Customer relationship damage from missed delivery commitments, which rarely repair as quickly as the production line does
- Employee morale erosion when workers recognize that repeated failures stem from system problems — not bad luck
Warning Signs You're About to Experience a Downtime Event
Most unplanned stops don't arrive without signals. Three patterns consistently precede them:
Increasing micro-stops and minor faults — short interruptions that accumulate into significant lost availability. Rising frequency in OEE performance loss data typically signals mechanical or process degradation before a full stop occurs.
Aging equipment without updated maintenance records — technicians troubleshooting from memory rather than accurate service history extends response time and multiplies repeat failures. NIST finds that reactive-maintenance-heavy facilities experience 3.3x more downtime as a result.
Rising dependency on a small number of veteran operators — when production stalls until one specific person arrives, tribal knowledge concentration has become a structural vulnerability. The fix is systematic, not personal: the expertise needs to live in the system, not just in one person's head.
How to Prevent Heavy Manufacturing Downtime
No single tactic eliminates downtime. What works is a layered approach where proactive maintenance, knowledge standardization, operational visibility, and supply chain management reinforce each other. Each layer addresses a different root cause; together, they reduce both the frequency and duration of stops.
Implement Proactive and Predictive Maintenance
Shift from reactive maintenance to a structured program combining preventive schedules with condition-based monitoring — vibration analysis, thermal imaging, oil analysis — on critical assets.
Condition monitoring catches degradation before it triggers an unplanned stop, converting potential failures into planned interventions with no emergency premium. McKinsey reports that predictive maintenance typically reduces machine downtime by 30% to 50% and increases machine life by 20% to 40%.
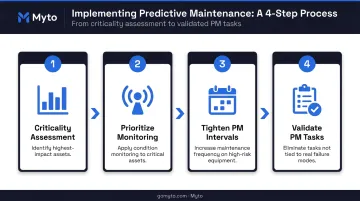
Where to start:
- Run a criticality assessment — identify which assets cause the most downtime when they fail
- Prioritize those assets for condition monitoring first
- Tighten PM intervals on high-criticality equipment
- Validate every scheduled maintenance task against actual failure modes; eliminate tasks that don't target a real risk
The DOE's O&M Best Practices Guide puts reactive maintenance at $18 per horsepower per year versus $9 for predictive maintenance — a directional benchmark that reflects why the strategy shift pays off beyond just downtime hours.
Capture and Standardize Frontline Operator Knowledge
Systematically document the troubleshooting procedures, setup sequences, and machine-specific expertise that currently exist only in experienced operators' heads. The goal is building procedures from how the best operators actually work — not theoretical manuals written from the top down.
When any operator can access what the most experienced team member would do in a given situation, resolution times drop and repeat failures from incorrect troubleshooting decline. Institutional knowledge stops depending on one person and becomes accessible to the whole team.
Platforms like Myto approach this through wearable AI glasses that capture operator expertise hands-free, in the natural flow of work — no tablets, no paperwork, no stopping to record. As senior technicians troubleshoot, run setups, or handle fault events, the glasses capture footage and audio automatically. Myto's AI structures that content into SOPs, troubleshooting flows, and shift-handover documentation — surfaced to any operator during a live fault event.
During an active downtime event, Myto's AI troubleshooting system:
- Pulls relevant equipment history and loads the applicable SOP
- Surfaces likely root causes based on the fault pattern
- Walks the operator through a diagnostic checklist in real time
- Handles shift handovers with a structured, AI-assembled document next-shift leaders can actually use
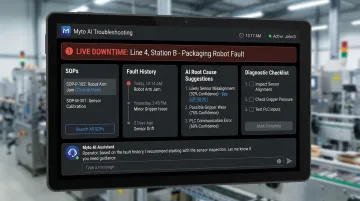
No waiting for the one senior tech who knows the machine.
Prioritize the most complex machines and the procedures most at risk of loss — particularly where experienced operators are approaching retirement or where shift handoffs are a known weak point.
Strengthen Spare Parts and Supply Chain Buffers
Conduct a critical spares analysis to identify which components — if unavailable — would cause the longest production stops. Maintain minimum stock levels for those items and tighten supplier lead time management for key materials.
This eliminates the scenario where a line waits not because anything failed mechanically, but because the right part isn't on site — converting an uncontrolled stop into a planned intervention.
Run the criticality assessment alongside the maintenance program review so spare parts strategy aligns with the assets identified as highest risk. Both workstreams should share the same asset priority list.
Tips for Long-Term Downtime Control
Sustaining improvement requires embedding these practices into daily operations, not treating them as one-time projects:
- Track the right metrics — OEE availability, MTBF, and MTTR broken down by machine, line, and shift. A facility-wide average obscures where improvement is actually needed.
- Audit PM tasks against actual failure modes — review scheduled maintenance tasks to confirm each one targets a real failure mode. Outdated tasks waste technician hours without reducing breakdowns.
- Build cross-training programs — distribute critical knowledge across at least two or three operators per machine, eliminating single-point-of-failure dependency on individual team members.
- Run structured weekly downtime reviews — analyze the top recurring causes, assign corrective actions, and track closure. Without this loop, the same failures repeat indefinitely.
These practices compound over time. Each PM interval tightened on real failure data, each operator cross-trained, each corrective action closed — the effect accumulates. Incidents become less frequent, and when they do happen, recovery is faster.
Conclusion
Heavy manufacturing downtime has identifiable causes — equipment failure, knowledge gaps, process inefficiency, and supply chain gaps — and each one responds to the right combination of maintenance discipline, operator capability, and operational visibility. Facilities that improve consistently have built systems to catch failures before they happen and resolve them faster when they do — equipment age matters far less than operational discipline.
The shift from reactive to proactive is not a one-time project. It compounds over time. Each failure prevented reduces pressure on technicians. Documented procedures expand what the whole team can handle — not just the one person who's been there longest. When operators can diagnose a fault without waiting on that single subject-matter expert, that's a resilience gain that carries through every shift, every crew change, every new hire.
Platforms like Myto help accelerate this by capturing the knowledge operators create in the natural flow of work — turning it into structured troubleshooting guides, auto-generated SOPs, and AI-assisted diagnostics that keep production moving even when your best people aren't on the floor.
Frequently Asked Questions
How much does downtime cost in heavy manufacturing?
The cost varies by sector and facility size. ABB's 2023 industrial survey puts the average across industrial operations at $125,000 per hour; for large automotive plants, Siemens/Senseye's 2024 analysis puts it at $2.3 million per unproductive hour. Losses span idle labor, emergency repair premiums, and quality defects on restart.
How can heavy manufacturers reduce downtime?
Durable reductions require addressing equipment and knowledge factors together: proactive maintenance, standardized procedures drawn from how experienced operators actually work, real-time visibility into production, and critical spare parts on hand. No single lever holds improvement on its own.
What is downtime reduction in heavy manufacturing?
It's the systematic process of identifying root causes of production stops and implementing maintenance, operational, and knowledge-management practices that reduce both their frequency and duration. Progress is tracked through metrics like OEE availability, MTBF, and MTTR at the individual asset level.
What is the most common cause of unplanned downtime in heavy manufacturing?
Equipment failure is consistently cited as the leading cause, often driven by deferred maintenance or the absence of condition monitoring. Operator knowledge gaps and process failures are significant contributors that receive less attention and, in many facilities, account for more events than reported.
What is the difference between planned and unplanned downtime?
Planned downtime covers scheduled stops — maintenance windows, changeovers, shift transitions — that can be prepared for and compressed through efficiency work. Unplanned downtime is any unscheduled stop that arrives without buffer and compounds costs immediately from the first minute.
How do you measure downtime in manufacturing?
The basic formula: Planned Run Time minus Actual Operating Time equals Downtime Hours. Meaningful measurement goes further, tracking OEE availability, MTBF, and MTTR by individual asset and shift rather than as a single facility-wide average. That granularity is where real improvement opportunities surface.