Introduction
Manufacturing plants run on thin margins, and unplanned downtime hits those margins fast. According to ABB's 2023 "Value of Reliability" survey of 3,215 plant decision-makers, the typical industrial facility loses $125,000 per hour during unplanned outages — and 69% of plants experience at least one per month.
At that rate, the losses compound fast. The Siemens/Senseye "True Cost of Downtime" report found that large plants average 25 lost production hours every month from unplanned incidents alone.
This article covers the practical side of fixing that: what downtime actually costs, which metrics give you a real picture of machine performance, what's causing most failures, and the strategies that deliver lasting uptime gains, including approaches most plants have yet to adopt.
Key Takeaways
- Unplanned downtime averages $125,000/hour and affects 69% of industrial plants monthly
- OEE, MTBF, and MTTR are the three metrics that reveal exactly where performance is breaking down
- Nearly half of U.S. manufacturing maintenance is still reactive — meaning problems aren't caught until equipment fails
- Predictive maintenance cuts unplanned downtime by up to 50%
- When experienced technicians leave, undocumented knowledge walks out with them — and downtime follows
The True Cost of Poor Machine Uptime
Visible Costs Add Up Fast
The numbers aren't hard to calculate once a machine goes down. Take a line running 200 units per hour at $15 margin per unit. One hour of downtime is $3,000 in lost contribution — before you add idle labor costs, emergency technician call-outs, or the overtime needed to catch up on missed orders.
Multiply that across Siemens/Senseye's finding of 25 unplanned downtime hours per month, and a single facility is looking at $900,000 or more in annual lost contribution — from one machine category alone.
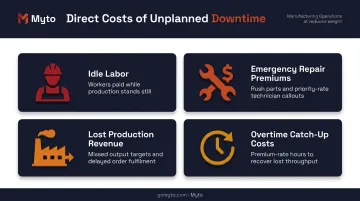
The immediate cost categories most plants track:
- Idle labor — operators and technicians paid while the line is stopped
- Emergency repair premiums — rushed parts orders, after-hours labor rates
- Lost production revenue — the output that never ships
- Overtime catch-up costs — often run at 1.5x or higher
Hidden Costs That Don't Show on the P&L
The harder-to-see costs are often worse over time. When technicians spend their shifts firefighting, safety risks climb — non-standard repair conditions, time pressure, and improvised fixes create scenarios that planned maintenance never would.
The customer relationship damage is just as serious. NIST's manufacturing machinery maintenance analysis estimated that preventable maintenance issues caused $100.2 billion in lost sales across U.S. manufacturing, driven largely by delivery delays and quality defects. Customers who get used to late shipments find other suppliers.
Industry Reality Check
Average machine uptime at process plants sits at just 67% of scheduled uptime, according to the PSbyM Process Industries Performance Study cited by Milliken. Facilities in the bottom third report uptime below 50%. Unplanned breakdowns account for roughly a quarter of that downtime, with unplanned maintenance making up 21% of all maintenance work.
These are industry averages, not outliers.
Key Metrics Every Plant Should Track
OEE: The Foundational Measure
Overall Equipment Effectiveness (OEE) blends three factors into one score:
- Availability — Was the machine running when it was supposed to?
- Performance — When running, was it running at full speed?
- Quality — Of what it produced, how much was good?
OEE = Availability × Performance × Quality
Benchmarks from LeanProduction/Vorne put world-class OEE at 85% for discrete manufacturers. A score of 60% is fairly typical, and 40% is common for plants just beginning to measure.
The real value of OEE is diagnostic: each component points to a different type of loss. Speed losses, minor stops, and defect rates all show up differently, which leads you toward different solutions.
MTBF and MTTR: Reliability and Recovery
These two metrics work as a pair:
- MTBF (Mean Time Between Failures) — how long equipment runs between failures. A declining MTBF signals recurring failure patterns that warrant root-cause investigation.
- MTTR (Mean Time to Repair/Resolution) — how quickly teams restore equipment after a failure. High MTTR often points to knowledge gaps, parts delays, or unclear repair procedures rather than equipment complexity.
Low MTBF calls for root-cause work on why failures keep recurring. High MTTR points elsewhere — to documentation gaps, slow parts sourcing, or undertrained techs. Same uptime problem, very different remedies.
Planned Maintenance Percentage: A Leading Indicator
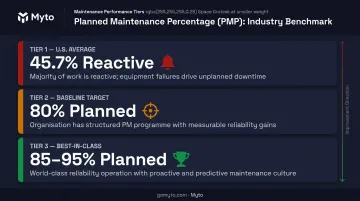
PMP measures what share of maintenance work is planned versus reactive. Industry guidance targets 80% PMP as a baseline. Here's how the benchmarks stack up:
- 45.7% reactive — U.S. manufacturing average, per NIST data
- 80% planned — baseline target for a healthy maintenance program
- 85–95% planned — best-in-class operations
Most plants are still spending nearly half their maintenance effort responding to failures rather than preventing them.
A rising PMP is one of the clearest early signals that a maintenance culture is shifting from firefighting to proactive management.
What's Really Causing Your Machines to Underperform
Three root causes account for most chronic machine underperformance.
Reactive Maintenance Culture
Plant Engineering's 2022 maintenance survey found that reactive maintenance accounted for 35% of maintenance strategies in industrial facilities, with predictive maintenance at just 14%. When the dominant response to equipment problems is "fix it when it breaks," you're guaranteeing unplanned downtime — because failure events are unpredictable by nature.
Calendar-based preventive maintenance is better, but it still misses the gap between scheduled intervals where real degradation occurs.
Lack of Condition Monitoring
Most equipment failure gives advance warning — if anyone is monitoring for it. Many facilities still rely on visual walkarounds rather than continuous condition signals. By the time a problem is visible to the naked eye, it's often close to failure.
Most equipment failure gives advance warning — if anyone is monitoring for it. Common early signals include:
- Abnormal temperature increases at bearings or motors
- Unusual vibration patterns during operation
- Rising motor current draw without load changes
- Sounds that fall outside normal operating range
Many facilities still rely on visual walkarounds rather than continuous condition signals. By the time a problem is visible to the naked eye, it's often close to failure.
Knowledge Concentration
This one rarely appears on a root-cause analysis, but it compounds every other problem. When the ability to diagnose a hydraulic issue or recognize a failing bearing lives in the heads of two or three veteran technicians, every absence creates a performance gap. The result: slower diagnosis, more guessing, inconsistent repairs, and longer outages.
The Manufacturing Institute found that 97% of surveyed manufacturers fear losing institutional knowledge as older workers depart. Deloitte projects U.S. manufacturing may need 3.8 million workers between 2024 and 2033, with up to 1.9 million jobs potentially unfilled.
Proven Strategies to Improve Machine Performance and Uptime
Daily Team Maintenance and Operator Ownership
Operators are the closest eyes and ears on any machine. A maintenance strategy that relies entirely on dedicated technicians misses the early signals operators notice first: an unusual sound, a slight vibration increase, a minor stop that repeats three times a shift.
Building daily team maintenance into standard practice means operators develop the skills to spot early deterioration and take ownership at the machine level. The practical impact: fewer minor breakdowns escalate into full stoppages, and maintenance teams spend less time on issues that operators could have flagged or handled at the source.
Shift from Reactive to Predictive Maintenance
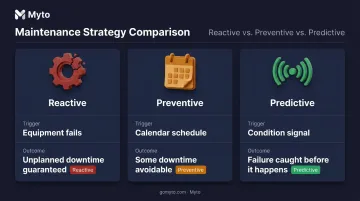
The three approaches differ significantly in when intervention happens:
| Approach | Trigger | Outcome |
|---|---|---|
| Reactive | Equipment fails | Unplanned downtime guaranteed |
| Preventive | Calendar schedule | Some downtime avoidable |
| Predictive | Condition signal | Failure caught before it happens |
Predictive maintenance uses vibration analysis, oil analysis, thermal imaging, and sensor data to catch failure patterns while equipment is still running. The Siemens/Senseye data from real deployments shows **up to 50% reduction in unplanned machine downtime** through predictive approaches. McKinsey's analysis of industrial operations cites downtime reductions of up to 50% and maintenance cost reductions of 10–40% as achievable outcomes.
The barrier to adoption is often perceived complexity. Condition monitoring doesn't require a full sensor overhaul to start — thermal cameras, vibration probes, and oil analysis programs can be layered in over time.
Reduce Changeover and Setup Time
Changeover time is counted as lost production time within OEE's Availability factor — and it's often larger than teams realize. The PSbyM study found average changeover time for primary production processes at 42 minutes, with one-third of plants reporting changeovers of an hour or more.
The SMED (Single-Minute Exchange of Die) methodology targets changeover under 10 minutes by separating tasks that must happen with the machine stopped from those that can be prepared in advance. A 2022 bearing manufacturing case study reduced total setup time by 34%, from 1,418 minutes to 930 minutes, without capital investment — just standardization and parallel preparation.
OEE data is the starting point here. If your Availability factor is dragging your score down and the machine is running fine when it runs, changeover is almost certainly a major contributor.
Standardize Troubleshooting Workflows
How fast a team recovers from a failure depends heavily on whether they have a tested procedure to follow. When troubleshooting steps live in someone's memory, every repair becomes a discovery process — slower diagnosis, inconsistent outcomes, and higher risk of repeat failures.
Clear, field-tested SOPs for common failure modes directly reduce MTTR. The procedure should reflect how experienced technicians actually solve the problem, not how a process engineer wrote it up eight years ago.
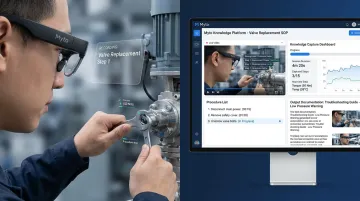
This is where platforms like Myto change the equation. Myto uses wearable AI glasses that record physical-world expertise as experienced operators work, hands-free, with no disruption to workflow. Agentic AI automatically structures the captured footage and audio into troubleshooting flows and SOPs.
For example, when a senior technician diagnoses spindle vibration, Myto captures the exact steps taken and builds a reusable procedure that includes:
- Likely root causes based on the technician's diagnostic path
- Equipment history context pulled from existing records
- A step-by-step diagnostic checklist for the next technician
That procedure is immediately available to any technician who encounters the same issue — cutting diagnosis time without waiting for the one person who knows that machine.
How Capturing Operator Knowledge Directly Reduces Downtime
The Core Problem with Tribal Knowledge
In most plants, the most valuable maintenance knowledge isn't in a manual. It's the sequence a senior technician uses to isolate a hydraulic fault, the specific sound that signals a bearing is two weeks from failure, the workaround that keeps Line 3 running when a part is on back-order.
When that person isn't available — on another shift, on vacation, retired — performance drops. Teams take longer to diagnose, make more second attempts, and sometimes misidentify the root cause entirely.
The Business Risk as the Workforce Ages
The workforce math makes this urgent. BLS data shows the median age of commercial and industrial machinery mechanics at 41.5 years, with electronic and precision equipment repair workers averaging 51.5. The largest concentration of industrial machinery mechanics sits in the 55–59 age bracket.
As that cohort retires, plants lose institutional memory that took years to accumulate. The Manufacturing Institute survey found 97% of manufacturers are worried about exactly this — and it's already slowing operations today.
How Myto Addresses the Knowledge Gap
Traditional documentation efforts — binders, one-off training sessions, shadowing programs — can't keep pace with a retiring workforce. Myto takes a different approach: the platform combines wearable AI glasses with agentic AI to capture and put frontline expertise to work before it walks out the door.
In practice, this looks like:
- Records troubleshooting steps, equipment maneuvers, and diagnostic decisions hands-free — operators work normally, no clipboards required
- Converts captured footage and audio into SOPs, troubleshooting flows, and shift-handover documentation automatically via agentic AI
- Surfaces equipment history, relevant SOPs, likely root causes, and a diagnostic checklist at the moment of a failure event — not after a 20-minute search
- Ingests data from existing CMMS, MES, ERP, and SCADA systems through Myto's Operational Data Integration layer, adding an intelligence layer without replacing current infrastructure
The Compounding Effect Over Time
The intelligence layer grows stronger over time. Each captured workflow, each maintenance ticket, each shift-handover note adds to the knowledge base. Agents are trained on your plant's specific operational data — not generic models — so their usefulness compounds as the system learns how your equipment actually behaves.
The downstream effect: every shift has access to the same standardized, field-tested knowledge. Uptime stops fluctuating based on who's in the building.
Frequently Asked Questions
How to improve machine uptime?
The fastest levers: shift from reactive to predictive maintenance, track OEE and MTTR to pinpoint specific loss types, and standardize troubleshooting workflows. Experienced operators' knowledge also needs to be documented and accessible across all shifts, not just when the right person is available.
How to increase productivity in manufacturing?
Reducing unplanned downtime, cutting changeover time, and maximizing machine availability are the most direct paths to higher throughput without capital investment. Equipping operators with the right workflows and knowledge at the right moment accelerates all three.
What is a good OEE score in manufacturing?
World-class OEE is benchmarked at 85% for discrete manufacturers, but many facilities average around 60% — and plants just beginning to measure often see 40%. Even small gains translate directly to meaningful production capacity without adding equipment or headcount.
What are the most common causes of unplanned downtime in manufacturing?
Plant Engineering's 2020 survey found aging equipment as the leading cause at 34%, followed by mechanical failure at 20%. Underlying most incidents are reactive maintenance culture and knowledge gaps when the right person isn't available during a failure event.
What is MTTR and why does it matter for machine uptime?
MTTR (Mean Time to Repair/Resolution) measures how long it takes to diagnose and restore equipment after a failure. Reducing it through better diagnostics, documented procedures, and accessible troubleshooting knowledge is one of the fastest ways to recover lost production time.
How does operator knowledge affect machine uptime?
Experienced operators recognize early failure signals, execute faster repairs, and prevent recurring issues. When that knowledge isn't captured and standardized, uptime becomes dependent on who's working that shift rather than a reliable, repeatable system that performs consistently across all shifts and facilities.